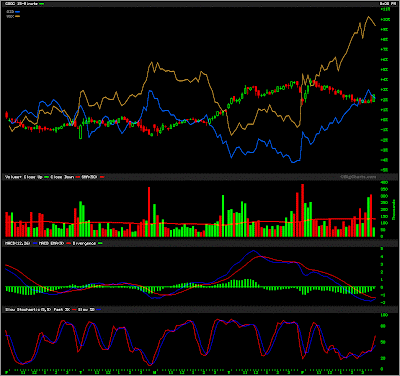
Google Inc.
Key Statistics
Profit margin: 28.30%
Operating margin: 35.78%
Return on Assets: 14.59%
Return on Equity: 20.70%
Revenue: 24.92B
Quarterly Revenue Growth (yoy): 23.00%
Quarterly Earnings Growth (yoy): 37.40%
Total Cash: 26.51B
Total Debt: 0.00
Shares Outstanding: 318.49M
Float: 248.02M
% held by Insiders: 0.50%
% held by Institutions: 81.20%
CEO: Eric Schmidt, 1,000
Co-Founder: Larry Page, 1,000.
Co-Founder: Sergey Brin, 1,000.
CFO: Patrick Pichette, 2.97M
Sr. VP: Jonathan Rosenberg, 2.47M
Candlestick analysis: "Sell If" due to Bearish Harami Pattern (American Bulls)
Summary: Fundamentals are very solid. New growth streams are, or were, going to kick tail and bring back much of the momentum lost in the pullout from China. For the first time in a long time, Google is positioned to rocket up thank to Android (mobile weapon vs. Apple's iPhone) and AdMob (mobile advertising). However, if the global market continues to suck, GOOG will be battered and tattered.
GOOG 5-day chart (15-minute bars)
A relatively solid week for Google shares despite a crummy market. Addition of AdMob (mobile advertising) and success of Android (mobile competitor to iPhone) are fresh growth drivers.
6-month (daily)
Can the market take GOOG apart with a second recessionary dip? Of course. But if this tumult turns out to be temporary, the upside is nice. The pullout from China, however, puts a lid on shares. Otherwise 550 and 600 wouldn't be so distant.
2-year (weekly)
GOOG up 2.7% for the week. Global economic chaos could send shares back to 300 as funds hit their profitable holdings for much-needed cash. I'd rather be positioned in cash for that dip than holding on through a nauseating drop.


No comments:
Post a Comment